


Disbursement Quotas and the Math That Shapes Philanthropy
Laying out assumptions and showing my work

When Canada raised the disbursement quota (DQ) for larger charities from 3.5% to 5% in 2022, it marked another shift in how foundation giving is governed. But two years later, the field is still grappling with what this change really means.
So let’s look at the math.
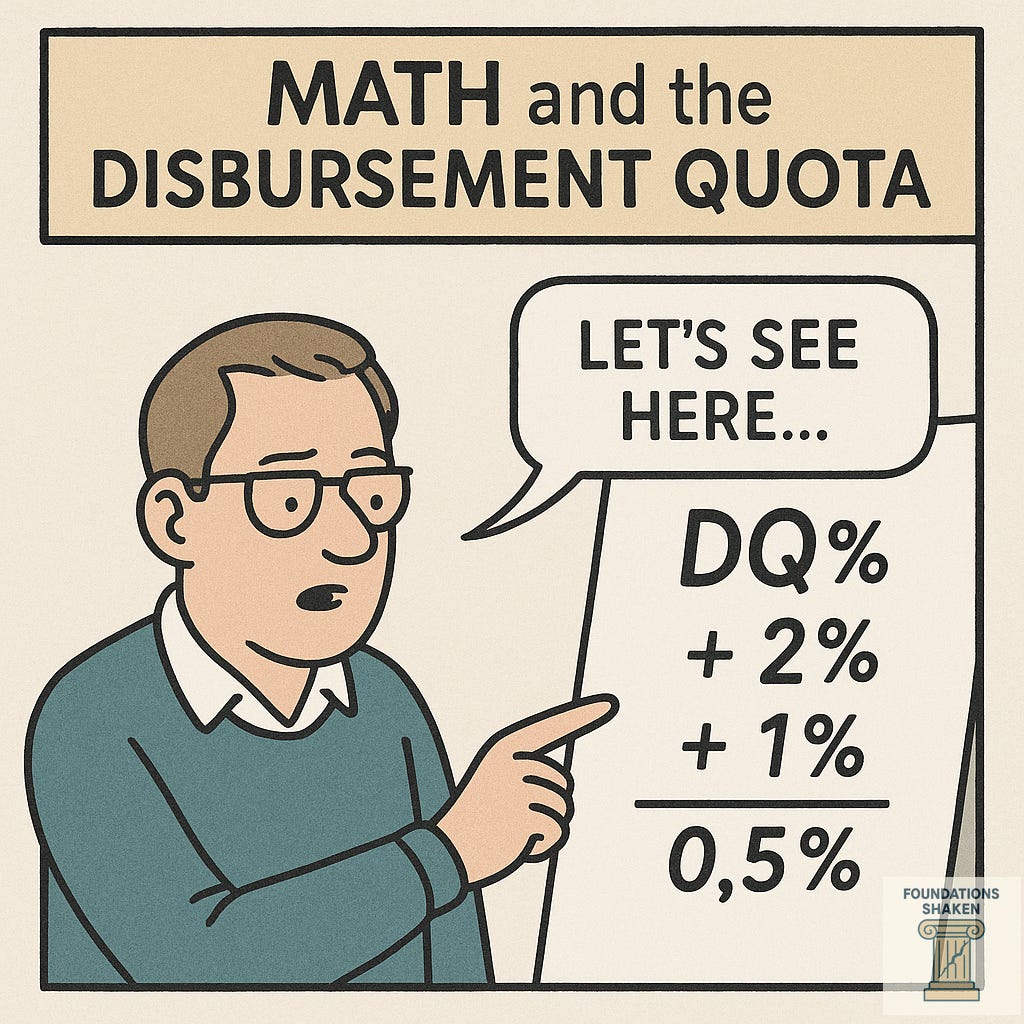
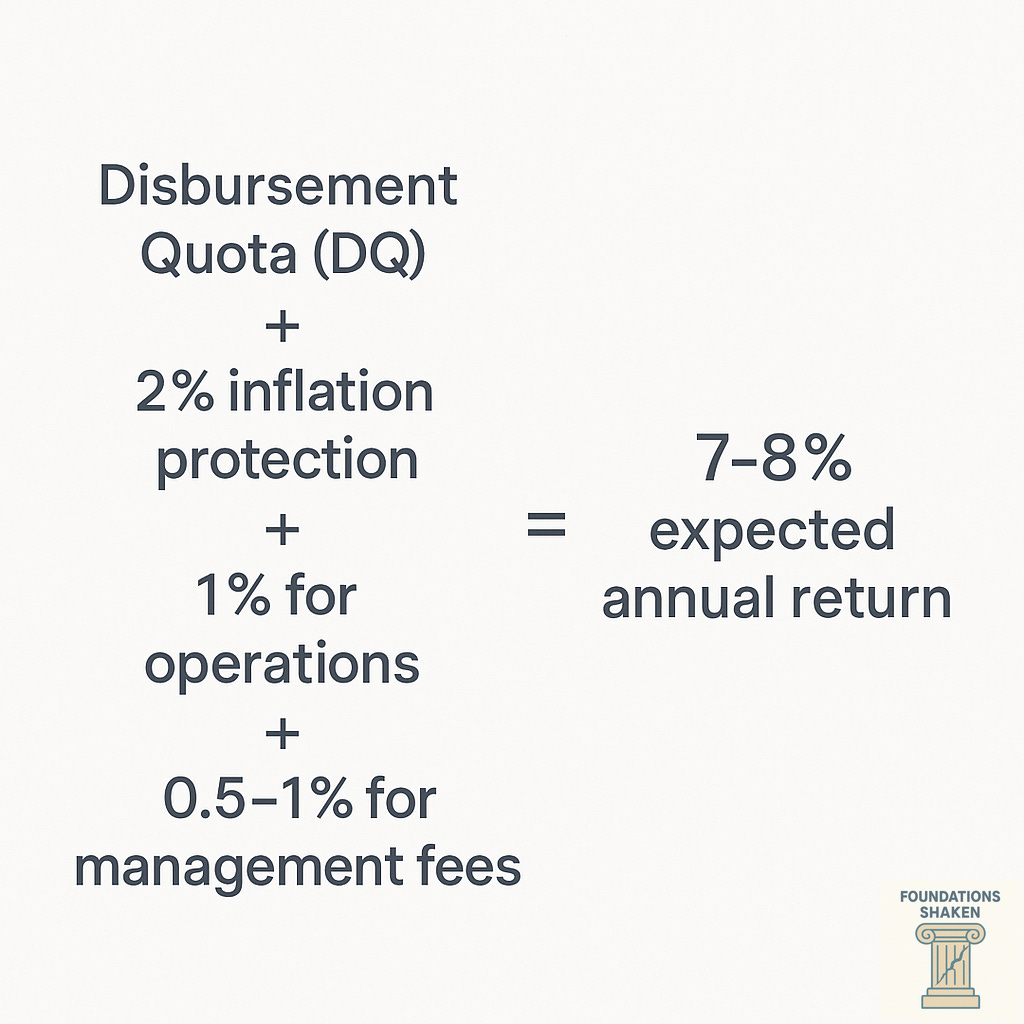
For decades, foundations used a fairly consistent internal rule of thumb to guide investment strategies:
That logic made sense when fixed income and conservative Canadian investments could safely yield modest, stable returns. But two of these assumptions have wobbled over the past several years. First, since 2008, foundations, like corporations, living in a 0% interest rate environment, were advised by their financial advisors to shift toward growth-oriented portfolios: global equities, alternatives, and more aggressive long-term strategies. Second, in the past couple of years, inflation was not 2% but 10% at certain times.
This means that the equation was under some strain with the increase in the DQ. There is evidence of some balance between those seeking growth in their investments and those still investing quite modestly. The latter might not have been pleased with the DQ increase.
However, if we look at the growth of foundation endowments and the number of foundations, most Canadian foundations are still generating approximately or just under 10% annual compound growth. That’s hardly extravagant.
Here's My Assumptions and My Math
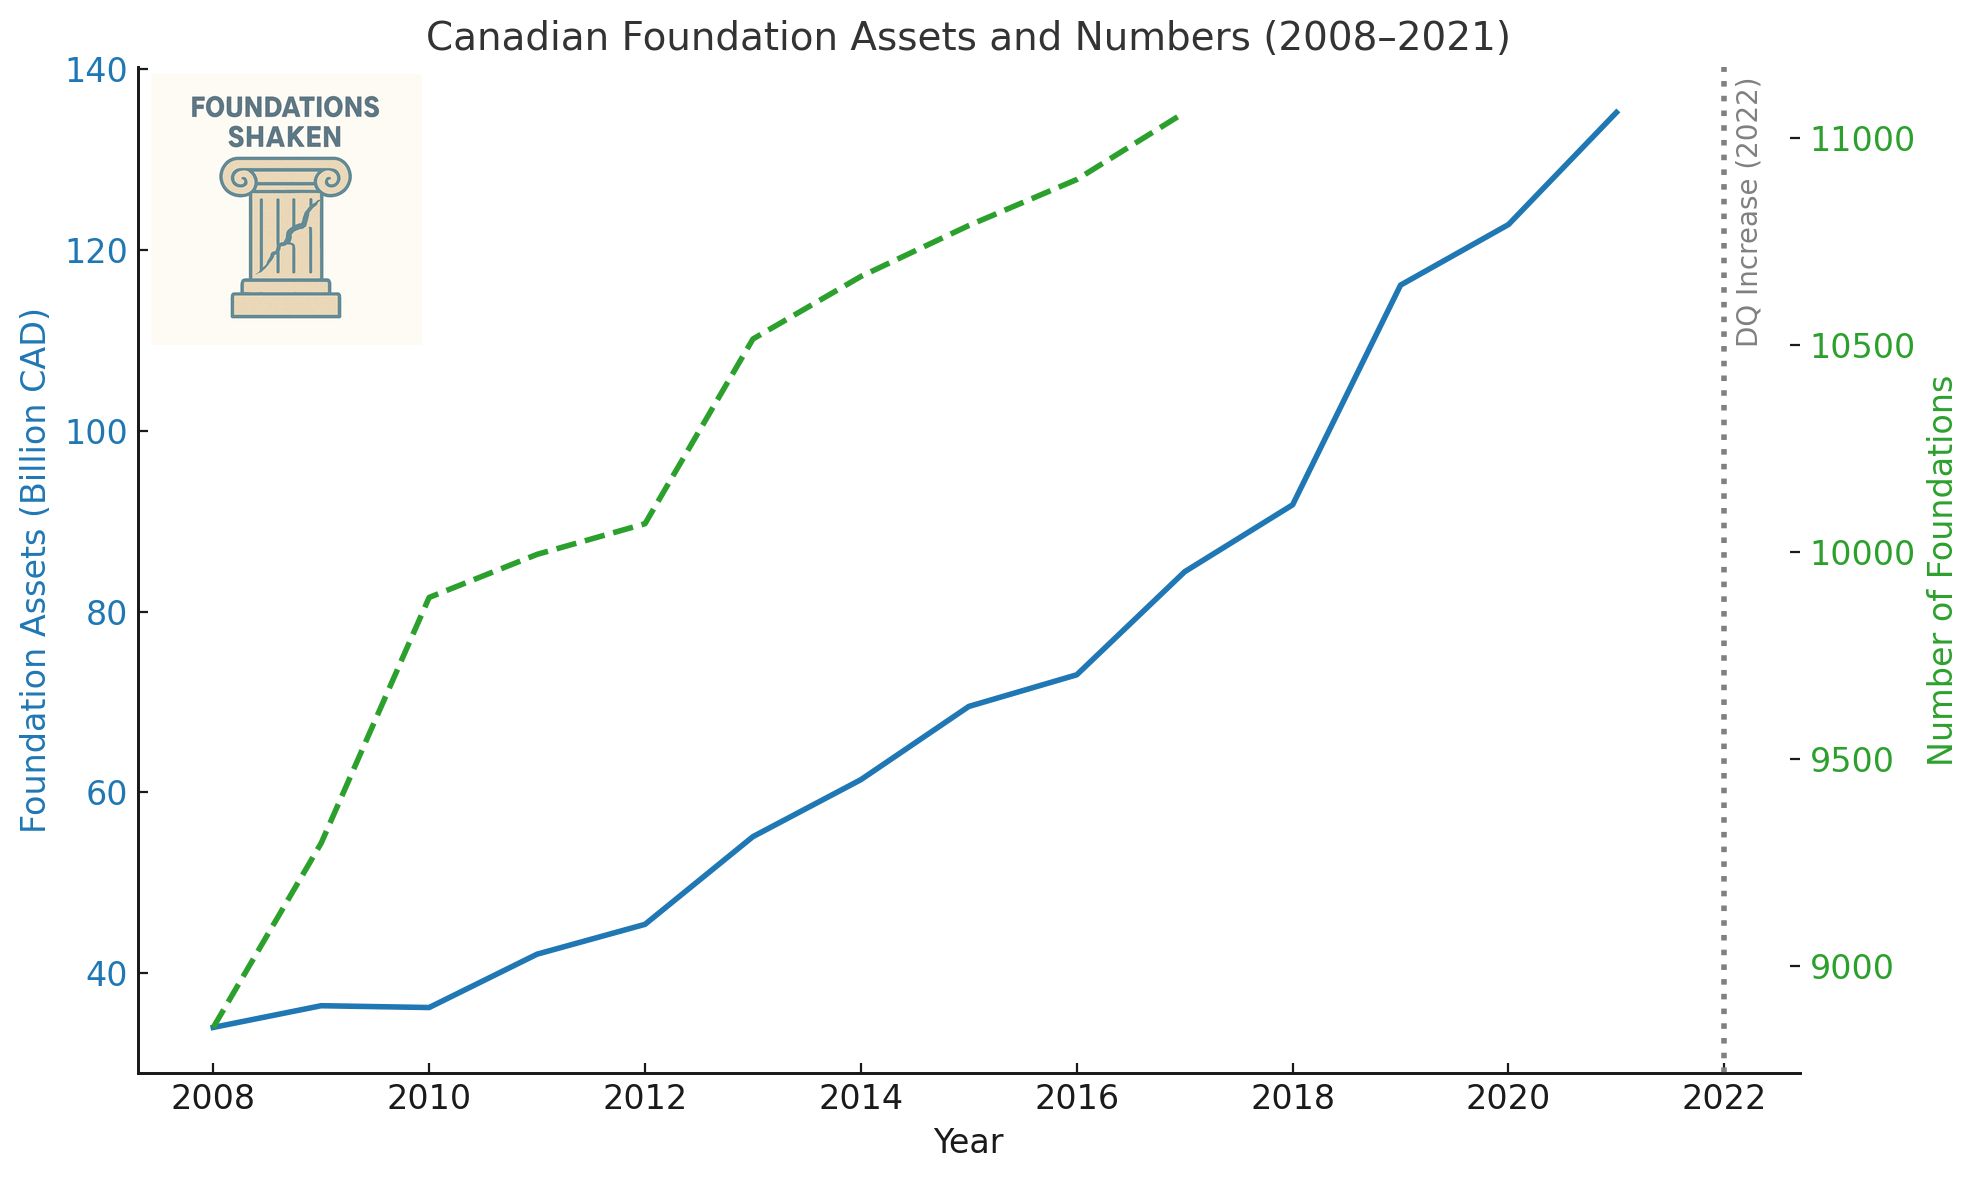
Between 2008 and 2021, a 13-year period:
Total foundation assets in Canada grew from $35 billion to $135 billion CAD, a compound annual growth rate of 10.94% (Compound Percentage Growth Rate-CPGR).
Between 2005 and 2021, a 16-year period:
During the same period, the number of foundations grew from about 9,890 to 11,061, ~1.56% per year (Annual Percentage Growth Rate- APGR) or about 138 new foundations per year. (This is a combined total for public and private foundations.)
Taking into account both the asset growth and the increase in the number of foundations, we can think of the overall growth as being driven by two factors:
More money per foundation (investment returns, new gifts, etc.)
More foundations contributing to the total (about 1,200 added from 2008 to 2021)
If the sector assets are growing at 10.94%, and the foundation count is rising at 1.56% annually, then the average growth in assets per foundation is about 9.38%. That means part of the asset growth is simply more entities being added, not higher investment performance:
So, the true annual growth in assets per foundation is likely closer to:
10.94%−1.56%≈9.38% per foundation
What does any of this mean?
First, APGR helps us frame foundation growth as expansion of the sector, not just financial performance. It supports narrative shifts: from "more wealth" to "more structures for wealth."
There is more modest per-foundation growth, even with $100b aggregate growth. Foundations aren’t necessarily earning or receiving 11% more per year; some of the asset growth is structural (more foundations created).
The 9.38% adjusted rate still suggests growth per foundation, likely from a mix of new contributions and market returns, especially in high-performing years (2016–2021). Some foundations are pursuing more growth strategies, but some aren't; they are probably in more of the risk-averse mode we expect from foundations.
Why does DQ, as a proxy, remain problematic?
So, does a higher DQ work?
It depends on your metric. If the goal is more money out the door, early evidence suggests: yes. Disbursements rose before the 2022 policy change (e.g. COVID), and they’ve risen more since.
What about the future?
Foundation assets continue to grow, not just because of strong investment strategies, but because the sector itself is expanding. More foundations mean more aggregate wealth.
In a 5% disbursement quota (DQ) environment, foundations may now target annual returns of 9–10%, up from the traditional 7–8%. This allows them to spend more and grow their assets, without drawing down their endowments.
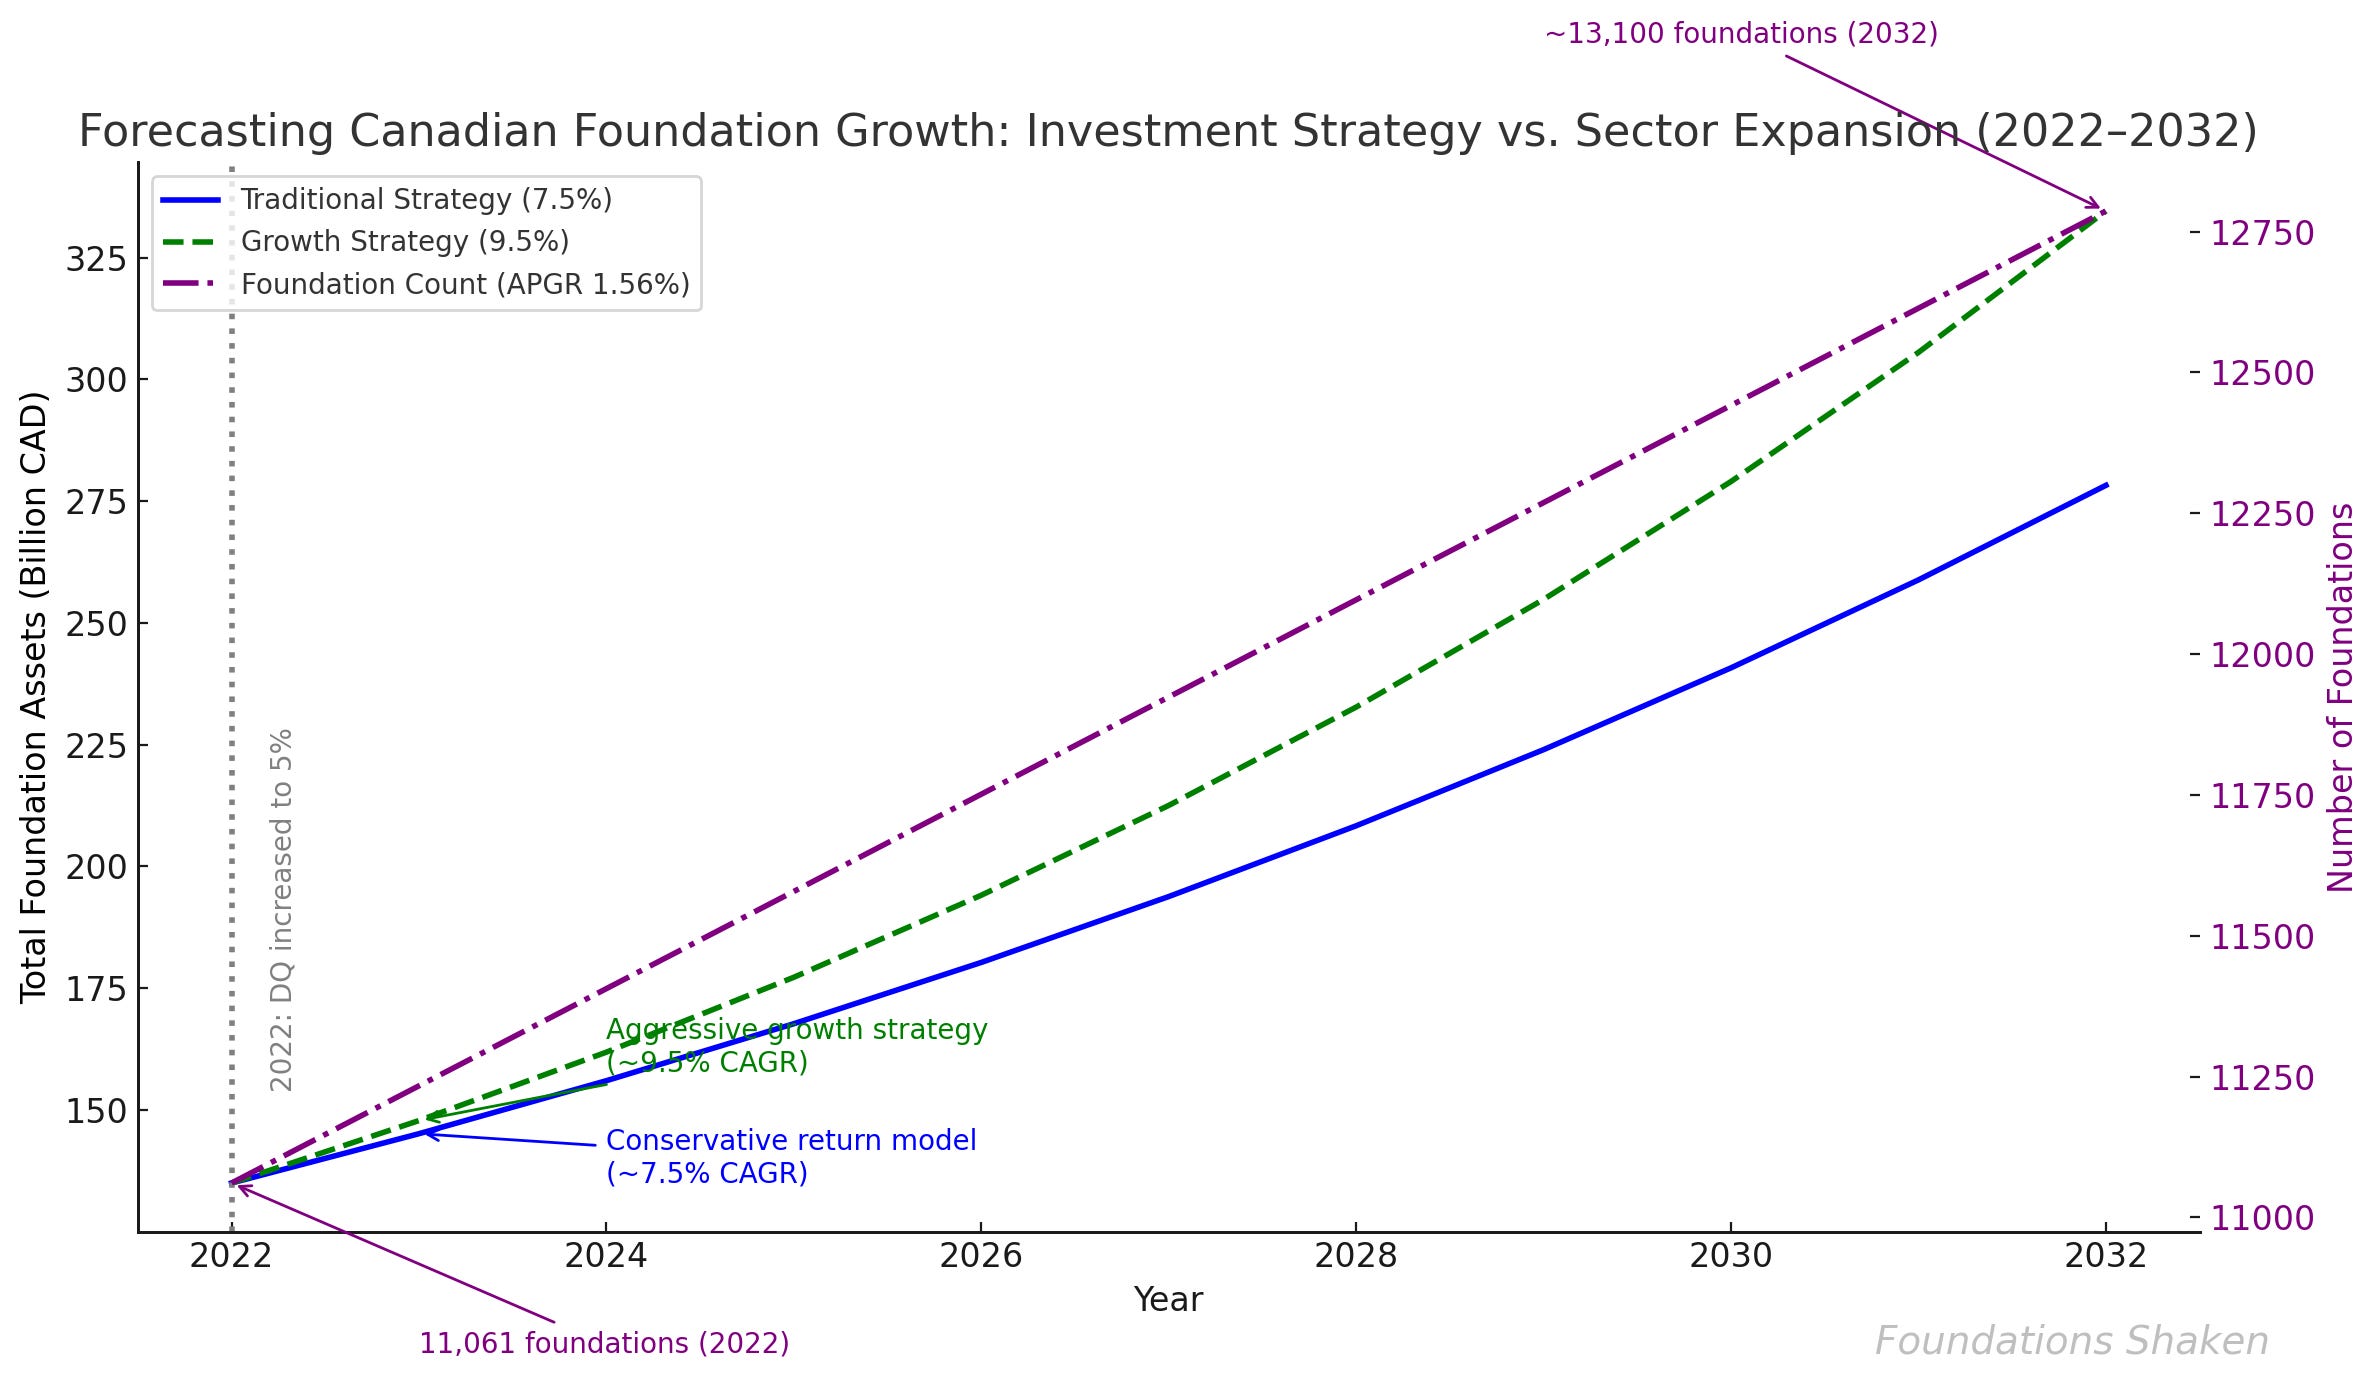
Asset Growth Lines
Blue Line – Traditional Strategy (CPGR 7.5%): Assumes a conservative portfolio with Canadian bonds and equities. Matches historical 7–8% target return used in previous DQ-era models.
Green Dashed Line – Growth Strategy (CPGR 9.5%): Reflects shift to global equities, alternatives, and higher-risk profiles. Matches modern strategies aiming to outpace inflation and 5% DQ.
Foundation Count (APGR 1.56%)
Purple Line - Linear growth in foundation creation. New foundations contribute to total asset growth without affecting individual investment strategy.
Note: Asset growth projections are compounded annually. Foundation count growth is linear based on an average percentage increase (APGR), not compounded.
It creates a kind of cognitive dissonance: individual foundations may be earning modest returns, yet the sector as a whole is experiencing significant aggregate growth, likely driven by a subset of foundations pursuing more aggressive growth strategies.
This presents a challenge for those who didn’t fully anticipate how changing investment strategies and DQ policy interact. Aggregate assets will likely keep rising, especially for foundations that consistently meet these higher return targets.
For policymakers or boards, it's important to disaggregate:
How much asset growth is new capital entering the system?
How much is due to investment strategy?
And how much is due to simply more foundations existing?
What do we really want to know?
First, I’ve written this before, there are two separate questions here:
Should foundations spend more annually? (i.e., higher disbursement quotas)
Should they spend from the principal? (i.e., spend down the endowment, potentially sunset)
If you're trying to both spend more and shrink the endowment, a DQ over 10% might be necessary. But maybe that misses the real point: how do foundations actually support civil society? What's the public contract beyond these proxy targets, and how do we help them articulate it more clearly and more boldly?
Secondly, Canadian data can’t easily show where this money is going or whether it’s reaching communities with the greatest need. That’s why we need more research. (Forthcoming).
If future DQ policy changes are on the table (which they are), they must take several intersecting realities into account:
Not all foundations are sitting on double-digit returns.
The growth in total assets is partially structural, not just strategic.
DQ shifts affect grantmaking, but we need better data on what that actually funds.
Pressure to spend can create new operational challenges for leanly staffed foundations.
Canada’s disbursement quota is a blunt tool, but not a meaningless one. It’s an accountability lever. The real work now is figuring out how to aim it better or get to the real issue of better demonstrating foundation accountability to civil society.
This post is limited by its Canadian perspective, but it might resonate in other jurisdictions. The UK is interesting in that it doesn’t have a DQ, but it could have the potential to leapfrog the North American examples with more of a total portfolio impact approach (grantmaking + social investments).
The data set is from the 2021 CRA T3010. CRA data is an open set, but runs about 18 months in arrears. You need to request the most recent data from CRA in this form.
If you think my math or the argument is dodgy, just let me know. I’m working and thinking aloud here.